Case Studies
As part of the ESRC eBook project, we were interested in how researchers conduct analyses in practice, with a mind to feeding this into the development of resources in Stat-JR; it was hoped that these resources, in turn, would help demystify elements of quantitative research, and aid researchers in conducting their own analyses.
To this end, we approached a number of quantitative researchers, inviting them to choose a research problem on which they were currently working, or had previously worked on, prior to interviewing them to try to capture the essence of how they approached their research question(s), and analysed the dataset of interest.
We then explored how to unpack, and present, elements of (often complex) workflows to try to render them more digestible to those newer to the field, also investigating how to render elements interactive: for example to demonstrate alternative routes which may have been taken at key decision points during the analysis, or to illustrate underlying concepts.
We are very grateful to all the following people, who generously made time to explore elements of their work with us:
- Ian Brunton-Smith (University of Surrey)
- Mark Gittoes (HEFCE)
- Harvey Goldstein (University of Bristol)
- Julia Gumy (University of Bristol)
- Kelvyn Jones (University of Bristol)
- Paul Lambert (University of Stirling)
- Paul Norris (University of Edinburgh)
- Martin Ralphs (UK Government Statistical Service's Good Practice Team, in the Office for National Statistics).
- Jen Rogers (University of Oxford)
- Mark Tranmer (University of Glasgow)
Different case studies lent themselves more obviously to different treatments, and so we explored a variety of approaches to breaking elements of the work down: writing novel Stat-JR templates, workflows and eBooks, exploring workflows via schematic diagrams, and so on.
When the software employed in the original analysis was part of an environment which offered sophisticated eBook-like and interactive tools of its own (e.g. R Markdown and Shiny, in the case of R), we also took the opportunity to explore those as well. See, for example, our case studies on measuring segregation, with Kelvyn Jones (in which we compare the opportunities offered by these resources against provision in Stat-JR, such as DEEP eBooks and LEAF workflows), smoothing crime data, with Martin Ralphs, and using joint frailty models, with Jen Rogers. Our case study with Harvey Goldstein explores using Stat-JR DEEP eBooks to replicate a published paper.
There were also instances where we were able to collaborate with a researcher to add functionality to some of the Centre for Multilevel Modelling's other software packages; for example Mark Tranmer provided very helpful feedback on, and examples for, our R2MLwiN package, enabling us to further refine it to handle syntax structures allowing users to more readily express multiple membership multiple-classification (MMMC) models, such as those Mark works on.
We encountered a number of interesting issues when translating workflows realised in third-party software into Stat-JR resources. For example, a number of the analyses we explored involved workflows which were (necesssarily) complex and lengthy; executing them in their entirety in that native software, but called from within a Stat-JR LEAF workflow and/or DEEP eBook, did not necessarily aid our objective of illuminating the work above-and-beyond what could be acheived in the original software environment (e.g. with carefully annotated syntax); however it did prove very valuable to take subsections of those analyses, and articulate them using Stat-JR's tools of templates, LEAF workflows and DEEP eBooks as a means of testing and extending elements of Stat-JR's own infrastructure, and investigating its ability to reproduce functions originally executed in third-party software: see, for example, our case study on online piracy, with Ian Brunton-Smith, measuring social distance, with Paul Lambert, and our case study exploring negative binomial models to analyse homicide rates across European countries, with Paul Norris.
We also noted that datasets archived and curated by public bodies, to which we in turn applied for access, had sometimes changed in important ways, and in a manner which was not always explicable - this raised challenges when attempting to replicate analyses.
Finally, some of the case studies concerned research questions which required highly specialist software (and sometimes hardware) to address them: for example, our case study visualising young people's HE participation rates, with Mark Gittoes, mapped geographical data with relatively fine granularity over large geographical areas; existing tools (and the servers on which they are hosted) such as Google Fusion, for example, can offer infrastructure well-suited to visualising such data in a publicly-accessible way.
Keeping it 'simple': exploring simple linear regression
As well as the case studies, above, we also asked each of our regular attendees to the Centre for Multilevel Modelling reading group to choose a question/hypothesis and dataset which involved one response variable and one predictor variable, and then perform all the steps required to answer that question/hypothesis. They were asked to bring along a document detailing the processes they had gone through in data collection/exploration and analysis, and some indication of what would go forward to a report/paper on the topic, with any logfile / syntax file from your analysis. They could pick any dataset / software package they liked (and use any software they wished), with the only restriction being: one response (dependent / outcome) variable, and one predictor (independent / explanatory) variable.
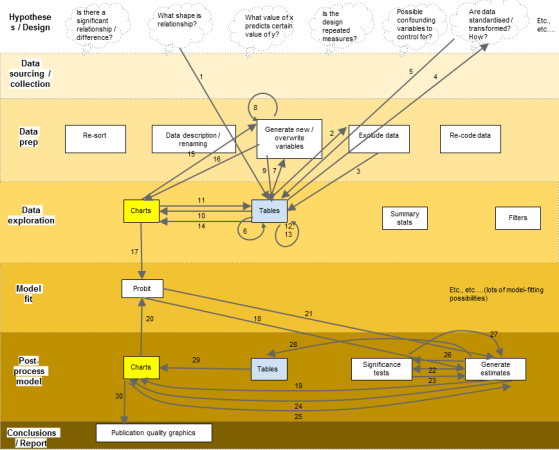
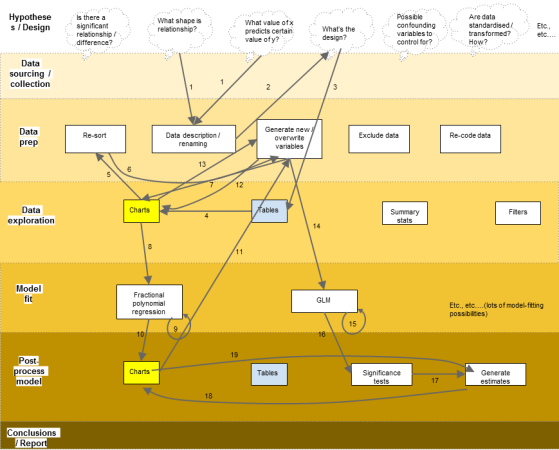
We found that, despite the task having a relatively simple premise, it motivated a number of very interesting discussions concerning how different people go about analysing data. After the reading group, we took a sample of analyses, and explored representing them schematically in flowcharts, for example:
Example A

Example B

Example C

Whilst this is just one way to illustrate such a workflow, it does reveal some interesting features. For example, whilst the colour code for the horizonal bars was chosen to imply incremental progression from inital hypotheses / design to a conclusion, any such progression is clearly not a linear one, and different 'phases' (e.g. of data prep) are revisited many times, with questions constantly being asked of the data as the analyst learns more about it.
Thanks to members of the CMM Reading Group - including Andrew Bell, Chris Charlton, Gavin Dong, Rob French, Mark Hanly, Kelvin Jones, George Leckie, Dewi Owen, Gwilym Owen, Kaylee Perry, Adrian Sayers, Bobby Stuijfzand, Puneet Tiwari, Lei Zhang - for participating!